Intro
Previously when I wrote about the 8700k I deliberately left out data on temperature and more detailed depth into power and clock speeds.
I’ll also add that over time UEFI updates have invalidated the required voltages for the overclocks that I tested. To address all this, I acquired a delidding kit, the Rockit 88, and the required liquid metal in to make the process worth its while.
I’ll be retesting the previous benchmarks and going through the proven method of overclocking and then giving you a breakdown of the data collected i.e. scores and hwinfo64 sensor data.
Take the collected scores with a grain of salt because I’ll be running hwinfo64 in the background and using it to write a CSV log to the disk of multiple sensors from temperature to voltages and watts.
Specs
Starting with the basics of the 8700k:
- 6 cores
- 12 threads
- 3.7GHz base clock
- 4.7GHz uni-core turbo
- 4.6GHz duo-core turbo
- 4.4GHz tri or quad core turbo
- 4.3GHz penta or hexa core turbo
- 95w TDP
I want to explain TDP:
Intel defines TDP as follows:
The upper point of the thermal profile consists of the Thermal Design Power and the associated Tcase value. Thermal Design Power should be used for processor thermal solution design targets. TDP is not the maximum power that the processor can dissipate. TDP is measured at maximum Tcase. The thermal profile must be adhered to to ensure Intel’s reliability requirements are met.
This is from an Intel white paper document comparing Intel TDP on Xeon vs AMD ACP on Opteron but its totally relevant to the current desktop processor market. Intel has designed the 8700k to work around that 95w value not only in the out of the box clock values but also in the manufacturing of the chip itself. Being a publicly traded profit motivated company Intel is forced to keep costs down wherever possible and one of those places over the past couple years was the mainstream consumer desktop processor line. In the last article I only lightly touched on the thermal interface material that is used under the integrated heat spreader but now I have first had experience with what is under there and its not good. When you purchase your shiny new Intel processor there is a dried up inefficient monster lurking inside. Its job is supposed to be to assist in the transfer of heat from the processor die to the heat spreader and it does its job good enough for the rated TDP but that’s about it. When you start pushing a TDP of 150w or more things get interesting and not in a good way.
Method
DISCLAIMER: I can’t be held responsible for any damages that might occur if you delid your processor.
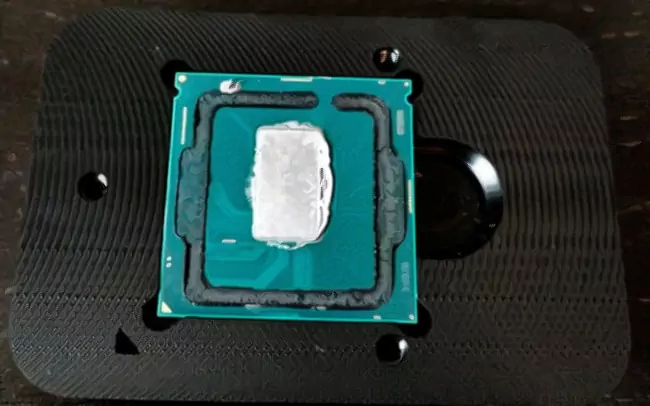
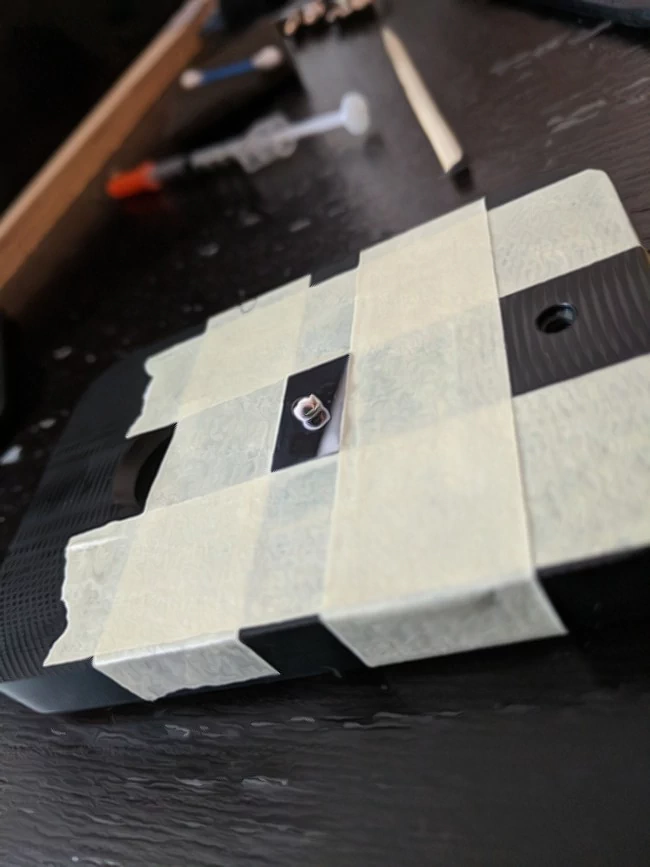
Time to control the monster and in the process, increase efficiency. Delidding might sound like a scary risky thing but in all reality, it’s not. If you prepare with a well-made kit and watch a video or two on YouTube about it everything should be a piece of cake. I was able to easily remove the heat spreader and with the included wooden wedge tool I cleaned off the black gasket material from the processor and the heat spreader. Once I did that I cleaned everything off with rubbing alcohol and then applied the liquid metal to the bare die and then to the bottom of the heat spreader. The last part was just putting a dab or two of super glue to the sides of the heat spreader and then clamping everything down for an hour to set. After that I just installed the processor in my AsRock Extreme4, put some Kryonaut on top and clamped down my Noctua NH-D15. The case environment for the tests is my Fractal Design Define S with no body panels on the sides or front and one Noctua fan on the rear as an exhaust along with the two fans on the heatsink all pointing the same direction at max speed.
My testing method will start with setting the CPU to auto for everything and power savings are enabled. After that I will manually set the core and cache to 3.7GHz and then begin the journey upward in core clock speed, stepping up the voltage when any instability is encountered. The most stressful test that I’m running is Asus RealBench 2.43 so to cut down on time required, that will be the only test I run to ensure stability. Once I get to 5GHz I begin stepping up the cache clock with small voltage adjustments along the way if required. A final clock speed will be considered by encountering a CPU package temperature of around 80c for very stressful loads. The load line calibration setting for manual clock speeds will be the highest setting for my AsRock z370 Extreme 4 motherboard and the AVX offset will be 2x.
Results
Let’s dig into what I found out!
Auto UEFI Settings
I wasn’t quite sure that the auto setting was working correctly but after checking my UEFI settings and watching the monitors for clock speeds and voltages everything was correct and to Intel spec. For most of the time the core clock speed was at 4.3GHz and the cache was at 4GHz the core did spike into 4.5GHz for short bursts. Voltages during the GIMP test were 1.200v to 1.255v. When the encoding started it was 1.152-1.168v. For the OpenCL section it decided that 1.232v was required. On the heavy multitasking it dropped down to the same voltages as the encoding test.
Temperatures were at 30-39c during the GIMP test. 40-49c for the encoding test. For the rest of the tests temperatures were 44-52c.
Power draw was under 40w for the GIMP test. Encoding was 100-109w. OpenCL draw a flat 80w and heavy multitasking was 95-107w.
Scores:
- Image Editing - 154514
- Encoding - 249915
- OpenCL - 132842
- Heavy Multitasking - 214290
- Total - 161321
4.3GHz Manual “Overclock”
This really isn’t an overclock as much as it is a test to see if I can do better then auto did. On my processor I was able to get 4.3GHz running with 1.100v. The clock speeds were at 4.3GHz for the non AVX part of the test and 4.1GHz for the AVX parts. Voltages were locked at 1.088v from the motherboard Vcore.
Temperatures on the GIMP test were pretty much 30c. Encoding had the CPU at 45c. OpenCL hovered around 40c and heavy multitasking was around 45-49c.
The GIMP test only drew 30-35w of power. Encoding drew the rated Intel spec TDP. OpenCL drew a flat 57w and the heavy multitasking drew a max of the Intel spec TDP.
Scores:
- Image Editing - 165587
- Encoding - 242121
- OpenCL - 132842
- Heavy Multitasking - 212078
- Total - 161588
4.5GHz Manual “Overclock”
To cover the last of the bases from the auto settings I tested a manual 4.5GHz with 1.200v. Clock speeds were at 4.5GHz with the dip down to 4.3GHz on AVX loads. Voltages were right on that 1.200v target from the sensor.
The temperature during the GIMP section of the testing was under 40c. Encoding brought things up to 50-55c. OpenCL had things at 45-48c. Heavy multitasking was able to hit 55c but mostly it was under that.
Power draw for the GIMP test section stayed under 40w but launched up to 120w during the encoding test, the OpenCL GPU test had it around 74w, but it bounced back up to 110w almost 120w in heavy multitasking.
Scores:
- Image Editing - 173338
- Encoding - 257133
- OpenCL - 132842
- Heavy Multitasking - 216501
- Total - 168385
4.7GHz Manual Overclock
This level I’d consider the first real overclock and it was achievable with 1.200v.
Temperature during the GIMP test was 30-40c. Encoding hovered around 50c with a small blip into 55c. OpenCL kept things around 45c. Heavy multitasking nice and cool 50-55c.
Power draw during the GIMP test stayed around 40w. Encoding pushed power draw to 120-128w. OpenCL was around 78w and heavy multitasking drew 108-128w.
Scores:
- Image Editing - 179851
- Encoding - 259858
- OpenCL - 132842
- Heavy Multitasking - 225563
- Total - 172960
4.9GHz Manual Overclock
At 4.9GHz with an AVX offset of 2x you will be getting an overclocked all core speed along with a multicore enhancement style 4.7GHz during AVX workloads. I was able to get this stable with 1.270v.
Temperature during the GIMP test was 37-43c. Encoding hovered around 60c. OpenCL kept things around 50-55c. Heavy multitasking 60-65c.
Power draw during the GIMP test stayed around 40w. Encoding pushed power draw to 140-150w. OpenCL was around 97w and heavy multitasking drew 125-147w.
Scores:
- Image Editing - 185253
- Encoding - 268000
- OpenCL - 132842
- Heavy Multitasking - 231254
- Total - 177768
5.0GHz Manual Overclock
Now we get to the fun speed, pretty much the goal for most people is to hit 5GHz and call it a day. I was able to do this with 1.340v and remember, this is with a 3.7GHz cache clock speed and load line calibration on level 1 which on my motherboard doesn’t overshoot the voltage but it just barely delivers exactly what I set.
Temperature during the GIMP test was 37-45c. Encoding was 60-69c. OpenCL kept things around 50-61c. Heavy multitasking 67-73c.
Power draw during the GIMP test stayed around 50w. Encoding pushed power draw to 150-167w. OpenCL was around 107w and heavy multitasking drew 145-166w.
Scores:
- Image Editing - 187839
- Encoding - 276231
- OpenCL - 132842
- Heavy Multitasking - 233206
- Total - 180961
Advanced Overclocking
We hit our goal of 5GHz and now it’s time to start pumping up the cache clock speed. I was able to go from 3.7GHz cache to 4.3GHz cache in my testing. No voltage adjustment was required for up to 3.9GHz cache, so 1.340v was the limit. Temperatures were still in check, so I pushed the voltage to 1.350v and that gave me 4.0GHz and 4.1GHz. A voltage of 1.355v let me go to just 4.2GHz and I needed 1.360v for 4.3GHz. I decided to try my luck with a 5.1GHz core along with the 4.3GHz cache clock and I was successful at 1.415v and that is what I decided to stick with for 24⁄7 stable overclock.
5.1GHz Core 4.3GHz Cache Manual Overclock
Temperature during the GIMP test was 36-53c. Encoding was 67-75c. OpenCL kept things around 54-63c. Heavy multitasking 71-78c.
Power draw during the GIMP test stayed around 46-56w. Encoding pushed power draw to 165-189w. OpenCL was around 122w and heavy multitasking drew 165-187w.
- Image Editing - 196569
- Encoding - 278461
- OpenCL - 132842
- Heavy Multitasking - 240395
- Total - 185498
Comparisons
Here are all the RealBench scores in a tidy little chart.
And the temperatures, a little crowded and confusing but you’ll get the idea from it.
Well that was a ton of work to put together but those are the results that you can compare to if you were wondering about how your 8700k stacks up. The version of RealBench I used was 2.43. My 8700k was from batch number L730C339. I won’t be doing any more testing this year but expect more stuff from me in 2018. Thanks for reading!